<?xml version="1.0"?>
<News hasArchived="true" page="7725" pageCount="10777" pageSize="10" timestamp="Sun, 30 Aug 2026 05:58:33 -0400" url="https://my3.my.umbc.edu/posts.xml?mode=activity&amp;page=7725">
<NewsItem contentIssues="true" id="42288" important="false" status="posted" url="https://my3.my.umbc.edu/posts/42288">
<Title>Creating A Website Data Report: Three Degrees Of Separation</Title>
<Body>
<![CDATA[
    <div class="html-content">
    <table width="650">
    <tbody>
    <tr>
    <td>
    <div>
    <img src="http://statisches.auslieferung.commindo-media-ressourcen.de/advertisement.gif" alt="" style="max-width: 100%; height: auto;"><br><a href="http://auslieferung.commindo-media-ressourcen.de/random.php?mode=target&amp;collection=smashing-rss&amp;position=1" rel="nofollow external" class="bo"><img src="http://auslieferung.commindo-media-ressourcen.de/random.php?mode=image&amp;collection=smashing-rss&amp;position=1" alt="" style="max-width: 100%; height: auto;"></a> <a href="http://auslieferung.commindo-media-ressourcen.de/random.php?mode=target&amp;collection=smashing-rss&amp;position=2" rel="nofollow external" class="bo"><img src="http://auslieferung.commindo-media-ressourcen.de/random.php?mode=image&amp;collection=smashing-rss&amp;position=2" alt="" style="max-width: 100%; height: auto;"></a> <a href="http://auslieferung.commindo-media-ressourcen.de/random.php?mode=target&amp;collection=smashing-rss&amp;position=3" rel="nofollow external" class="bo"><img src="http://auslieferung.commindo-media-ressourcen.de/random.php?mode=image&amp;collection=smashing-rss&amp;position=3" alt="" style="max-width: 100%; height: auto;"></a>
    </div>
    </td>
    </tr>
    </tbody>
    </table>
    <p>Having a comprehensive data report about your website is like having a Rosetta Stone to guide your decision-making process over the lifetime of the website. A <strong>powerful report combines data gathered from a variety of sources</strong>, including observation of and interviews with users, and analysis of the website’s analytics. Assembling this information into one place will help you to make effective design decisions and determine key priorities and will strengthen your position when working with stakeholders.</p>
    <p>The goal is to put the key insights from your research of a website into a single document. The report would consolidate the most important discoveries from a variety of research techniques and would help you to identify trends. These trends would provide a more accurate view of your website than one research method alone could provide. Such a report is an extremely useful reference when redesigning a website or brainstorming about enhancements. It is also a deliverable that you can provide to your client, teammates or employer.</p>
    <p>A well-rounded report is built with a combination of <strong>data gathered from three sources</strong>: personal (qualitative research), community (quantitative research) and network (website analytics). Gathering personal data is a boots-on-the-ground initiative that involves speaking to users and watching them test the website. Community data is gathered by reaching out to the user base with surveys and feedback forms. An analytics tool collects network data on your website automatically. While these types of data are gathered separately, they complement each other and give you a full picture of what is happening on the website. For this article, I’ve created a fictional Widgets website, which we’ll work on together to build a data report.</p>
    <p><a href="http://media.smashingmagazine.com/wp-content/uploads/2014/03/01-widget-website.jpg" rel="nofollow external" class="bo"><img src="http://media.smashingmagazine.com/wp-content/uploads/2014/03/01-widget-website-500.jpg" alt="Data report for our fictional widgets website" width="500" height="552" style="max-width: 100%; height: auto;"></a><br><em>We’ll create a data report for our fictional Widgets website. (<a href="http://media.smashingmagazine.com/wp-content/uploads/2014/03/01-widget-website.jpg" rel="nofollow external" class="bo">Large preview</a>)</em></p>
    <h3>Gathering Personal Data (Qualitative Research)</h3>
    <p>The key to getting qualitative data from users is to observe them as they use the website. The first step is to gather some users to work through the most common tasks on the website. (If you’re unable to get a user in person, try out a service like <a href="http://www.usertesting.com" rel="nofollow external" class="bo">UserTesting</a>.) For our Widgets website, these tasks include finding a product, adding a product to the shopping cart, and finding a PDF download for one of the widgets.</p>
    <p>To understand their thought process and experience their frustrations, have the user talk through what they are doing as you take notes. This qualitative data will tell you how users behave and help you understand why. When multiple users have the same good or bad experience, note the recurring comment. The benefit of observing users is that you can see them discover things that they might not mention in an interview (or even be conscious of). After walking all of the users through the testing process, sit down and create the report.</p>
    <p>For this first section of our data report, list the action items from your notes. Multiple users found the same problem with our Widgets website, so we’ll mark that down, with a multiplier after the item to prioritize it in the list. A team is working on the Widgets website, so let’s break down the action items according to which groups would implement them. Only add to the report items that we might follow up on to update the website.</p>
    <p><a href="http://media.smashingmagazine.com/wp-content/uploads/2014/03/02-step-1-testingoutcomes.jpg" rel="nofollow external" class="bo"><img src="http://media.smashingmagazine.com/wp-content/uploads/2014/03/02-step-1-testingoutcomes.jpg" alt="Action items from user testing" width="500" height="277" style="max-width: 100%; height: auto;"></a><br><em>Action items from user testing, sorted by functional area.</em></p>
    <h3>Reaching Out To The Community (Quantitative Research)</h3>
    <p>Next, let’s get input from a broader group of users by sending a survey to our community or by conducting some interviews. The benefit of a survey is that we can quickly gather a lot of data and identify trends. A high number of responses will also help us to find some unique ideas and issues. The survey could be supplemented with in-person or phone interviews, which are opportunities to ask follow-up questions or to go completely off topic if something interesting comes up.</p>
    <p>To get started, let’s create a relatively short and simple survey about our website using <a href="http://www.surveymonkey.com" rel="nofollow external" class="bo">Survey Monkey</a>. To formulate our questions, let’s think first about what we want to discover. For our Widgets website, we want to gather some fairly anonymous demographic information, including the user’s profession and how often they use the website, and then dive into particular areas of the website. Leave some questions open-ended to get feedback that you might not anticipate.</p>
    <p><a href="http://media.smashingmagazine.com/wp-content/uploads/2014/03/03-step-2-survey.jpg" rel="nofollow external" class="bo"><img src="http://media.smashingmagazine.com/wp-content/uploads/2014/03/03-step-2-survey.jpg" alt="A survey created with Survey Monkey" width="400" height="346" style="max-width: 100%; height: auto;"></a><br>
    <em>A survey created with Survey Monkey.</em></p>
    <p>Having the user select from predefined answers will make it easier to compile results, but feedback is often better when the user enters their own thoughts. At the end of the survey, let’s ask some general questions, like what they like the most and the least about the website. These are all things that can be difficult to gather from analytics. Grow some thick skin because you might get some strong responses — but that’s what we’re looking for!</p>
    <p>Then, email all of your user lists and link to the survey from your home page and social network pages to get as much feedback as possible. Let people know that your goal is to improve their experience of the website and that their input will make a difference. Once you’ve gotten enough feedback, add it to the report.</p>
    <p>First, export all of the data from Survey Monkey into a spreadsheet and create some charts. For the open-ended questions, manually tally similar responses to show in a chart, or, if needed, list them as we did with individual testing.</p>
    <p><a href="http://media.smashingmagazine.com/wp-content/uploads/2014/03/04-step-2-results.jpg" rel="nofollow external" class="bo"><img src="http://media.smashingmagazine.com/wp-content/uploads/2014/03/04-step-2-results-500.jpg" alt="Charts created from survey data" width="500" height="452" style="max-width: 100%; height: auto;"></a><br><em>Charts created from survey data. (<a href="http://media.smashingmagazine.com/wp-content/uploads/2014/03/04-step-2-results.jpg" rel="nofollow external" class="bo">Large preview</a>)</em></p>
    <p><a href="http://media.smashingmagazine.com/wp-content/uploads/2014/03/05-step-2-openended.jpg" rel="nofollow external" class="bo"><img src="http://media.smashingmagazine.com/wp-content/uploads/2014/03/05-step-2-openended.jpg" alt="Open-ended questions listed and tallied" width="500" height="367" style="max-width: 100%; height: auto;"></a><br><em>Open-ended questions listed and tallied.</em></p>
    <h3>Tapping Into Our Network (Website Statistics)</h3>
    <p>For the third component of our report, we will tap our inner geek and gather some data from <a href="http://www.google.com/analytics" rel="nofollow external" class="bo">Google Analytics</a>, which has been running on our Widget website. Our users have already helped us understand how they use and experience the website, but analytics will give our report a foundation of solid data. Use analytics to track exactly how elements of the website are performing and to find some additional information about users. This data provides a perspective unclouded by emotion or opinion.</p>
    <p>Start by listing things that would be useful to track (downloads, PDFs, button clicks, conversion rate, banners, outbound links), and then see whether that data is available. If it’s not, there is probably a way to start tracking it for future insight. Creating goals or dashboards with these key items will keep the report up to date.</p>
    <p>The most interesting data points to track will depend on the type of website. If the website is content-driven, then categorize the content by topic or type (for example, infographic, review, press release, slideshow), and look at views, bounce rate and page duration. If it’s an e-commerce website, then set up some goal funnels, and compare the conversion rates of different products or pages. Look at your acquisitions to see where visitors are coming from (for example, social, search, email, direct, referral). This data will help you to identify where to focus your effort and will provide a point of comparison to measure the impact of that effort.</p>
    <p>Additional ways to gather data include A/B testing, heat mapping, and social network analytics. For this report, we want not just a list of numbers, but powerful data that can be compared. When you’re figuring out what data would be helpful to have, consider these four common goals for a website:</p>
    <ul>
    <li>
    <strong>Simplification</strong><br>What isn’t being used?</li>
    <li>
    <strong>Effectiveness</strong><br>How do similar items perform?</li>
    <li>
    <strong>Discovery</strong><br>What paths do users follow, and where do they stop?</li>
    <li>
    <strong>Technology</strong><br>How do users access (and experience) your website?</li>
    </ul>
    <p>For our Widgets website, let’s gather the following:</p>
    <ul>
    <li>
    <strong>Simplification</strong><br>
    	How often are some of the pages in the main navigation being viewed? (Or, more importantly, what isn’t being used?)</li>
    <li>
    <strong>Effectiveness</strong><br>
    	How popular are the various positions of the banner ads?</li>
    <li>
    <strong>Discovery</strong><br>
    	What percentage of users are browsing versus searching for products?</li>
    <li>
    <strong>Discovery</strong><br>
    	Where do users find news stories, and when do they read them?</li>
    <li>
    <strong>Technology</strong><br>
    	What types of devices are being used to view the website?</li>
    </ul>
    <p>Find the data that answers these questions. Then, create dashboards in Analytics, or export the data to a spreadsheet and create charts to drop into the report. Let’s also include some brief descriptions below the charts to explain the data. Rely on a variety of charts; a report with only pie charts would look boring, and we want to use the type of chart that best represents each piece of data.</p>
    <p><a href="http://media.smashingmagazine.com/wp-content/uploads/2014/03/06-step-3-categories.jpg" rel="nofollow external" class="bo"><img src="http://media.smashingmagazine.com/wp-content/uploads/2014/03/06-step-3-categories-500.jpg" alt="Charts representing data gathered from Google Analytics." width="500" height="600" style="max-width: 100%; height: auto;"></a><br><em>Charts representing data gathered from Google Analytics. (<a href="http://media.smashingmagazine.com/wp-content/uploads/2014/03/06-step-3-categories.jpg" rel="nofollow external" class="bo">Large preview</a>)</em></p>
    <h3>Finishing Our Report</h3>
    <p>Now that we’ve gathered all of this great data, let’s put the finishing touches on the report. In short, keep the content brief, use a lot of charts, and make the report easy to refer to; otherwise, you’ll cringe every time you have to dig in to find something.</p>
    <p>We’ve got our three key sections now. Let’s briefly summarize at the very beginning of the report how we’ve gathered the data, how many people we’ve spoken to and what we’ve discovered. Here are some key headings:</p>
    <ul>
    <li>
    <strong>Purpose</strong><br>
    What is our goal?</li>
    <li>
    <strong>Method</strong><br>
    How did we find the information?</li>
    <li>
    <strong>Findings</strong><br>
    What did we find?</li>
    <li>
    <strong>Implementation</strong><br>
    What should we do with this information?</li>
    </ul>
    <p>At the start of each section, briefly summarize the key discoveries, to make the section quicker to read through.</p>
    <p><a href="http://media.smashingmagazine.com/wp-content/uploads/2014/03/07-step-4-summary.jpg" rel="nofollow external" class="bo"><img src="http://media.smashingmagazine.com/wp-content/uploads/2014/03/07-step-4-summary-500.jpg" alt="A summary of key discoveries across all sections of the report." width="500" height="392" style="max-width: 100%; height: auto;"></a><br><em>A summary of key discoveries across all sections of the report. </em></p>
    <h3>Putting The Report To Use</h3>
    <p>Now that we’ve got an awesome data report, it’s time to put it to use. Share it around the company, hold a meeting to go over the findings, and print it out so that it’s handy.</p>
    <p>This report would be a helpful refresher to a freelancer who is switching projects and would be invaluable to someone who has just joined the company. Remember that this is a living document, so update it as needed.</p>
    <p>Having gathered data from these three sources, we’ve got a well-rounded view of our website. This triangulation of data will surface some common insights and will give you a truer picture of the state of the website than by using one research method alone. This combination of data is extremely helpful for brainstorming, too. For instance, we could gather the team and share a data point from each section — such as, testing revealed that widget accessories are hard to find; our survey showed that users would like to be walked through how to build a solution; and analytics show that most of our users are on a tablet or large display — and then brainstorm on how to meet these needs.</p>
    <p>In a few meetings, I’ve opened such a report on my laptop for quick access. It keeps me from having to dig for the right data or, better yet, prevents a debate that would derail the meeting. Such discussions would otherwise rely on guesswork or would be dominated by the highest paid person in the room — but not anymore with a trusty report at your side.</p>
    <ul>
    <li>Download a sample report in <a href="http://media.smashingmagazine.com/wp-content/uploads/2014/03/widgets-website-report.pdf" rel="nofollow external" class="bo">PDF</a> or <a href="http://media.smashingmagazine.com/wp-content/uploads/2014/03/widgets-website-report.docx" rel="nofollow external" class="bo">Word</a>.</li>
    </ul>
    <p><em>(al, ml)</em></p>
    <hr>
    <p><small>© Kyle Larson for <a href="http://www.smashingmagazine.com" rel="nofollow external" class="bo">Smashing Magazine</a>, 2014.</small></p>
    </div>
]]>
</Body>
<Summary>        Having a comprehensive data report about your website is like having a Rosetta Stone to guide your decision-making process over the lifetime of the website. A powerful report combines data...</Summary>
<Website>http://www.smashingmagazine.com/2014/03/11/creating-a-website-data-report-three-degrees-of-separation/</Website>
<TrackingUrl>https://my3.my.umbc.edu/api/v0/pixel/news/42288/guest@my.umbc.edu/9ecf54ae9bb0f98735b4c484ba820f74/api/pixel</TrackingUrl>
<Tag>css</Tag>
<Tag>design</Tag>
<Tag>development</Tag>
<Tag>html</Tag>
<Tag>javascript</Tag>
<Tag>mysql</Tag>
<Tag>php</Tag>
<Tag>sql</Tag>
<Tag>ux-design</Tag>
<Tag>web</Tag>
<Group token="retired-583">Web Developer - Build Group</Group>
<GroupUrl>https://my3.my.umbc.edu/groups/retired-583</GroupUrl>
<AvatarUrl>https://assets3-my.umbc.edu/system/shared/avatars/groups/000/000/583/fc60f5d7abc2e080599bb6dc465db54d/xsmall.png?1363101197</AvatarUrl>
<AvatarUrl size="original">https://assets4-my.umbc.edu/system/shared/avatars/groups/000/000/583/fc60f5d7abc2e080599bb6dc465db54d/original.jpg?1363101197</AvatarUrl>
<AvatarUrl size="xxlarge">https://assets4-my.umbc.edu/system/shared/avatars/groups/000/000/583/fc60f5d7abc2e080599bb6dc465db54d/xxlarge.png?1363101197</AvatarUrl>
<AvatarUrl size="xlarge">https://assets4-my.umbc.edu/system/shared/avatars/groups/000/000/583/fc60f5d7abc2e080599bb6dc465db54d/xlarge.png?1363101197</AvatarUrl>
<AvatarUrl size="large">https://assets3-my.umbc.edu/system/shared/avatars/groups/000/000/583/fc60f5d7abc2e080599bb6dc465db54d/large.png?1363101197</AvatarUrl>
<AvatarUrl size="medium">https://assets3-my.umbc.edu/system/shared/avatars/groups/000/000/583/fc60f5d7abc2e080599bb6dc465db54d/medium.png?1363101197</AvatarUrl>
<AvatarUrl size="small">https://assets4-my.umbc.edu/system/shared/avatars/groups/000/000/583/fc60f5d7abc2e080599bb6dc465db54d/small.png?1363101197</AvatarUrl>
<AvatarUrl size="xsmall">https://assets3-my.umbc.edu/system/shared/avatars/groups/000/000/583/fc60f5d7abc2e080599bb6dc465db54d/xsmall.png?1363101197</AvatarUrl>
<AvatarUrl size="xxsmall">https://assets4-my.umbc.edu/system/shared/avatars/groups/000/000/583/fc60f5d7abc2e080599bb6dc465db54d/xxsmall.png?1363101197</AvatarUrl>
<Sponsor>Web Developer - Build Group</Sponsor>
<PawCount>0</PawCount>
<CommentCount>0</CommentCount>
<CommentsAllowed>true</CommentsAllowed>
<PostedAt>Tue, 11 Mar 2014 07:00:55 -0400</PostedAt>
</NewsItem>

<NewsItem contentIssues="true" id="42286" important="false" status="posted" url="https://my3.my.umbc.edu/posts/42286">
<Title>Intriguing study reveals the secrets of successful infographics</Title>
<Body>
<![CDATA[
    <div class="html-content">
    <p><img alt="thu" src="http://netdna.webdesignerdepot.com/uploads/2014/03/thu1.jpg" width="200" height="160" style="max-width: 100%; height: auto;">What makes an infographic successful? As designers, we want it to achieve a balance of two main things:</p> <ul> <li>Did the reader get the message we wanted them to get?</li> <li>Was the message memorable?</li> </ul> <p>Doctoral student Michelle Borkin of Harvard’s School of Engineering and Applied Sciences worked with collaborators to collect, analyze and present 2,070 single-panel visualizations from a range of publications and websites.</p> <p>In the “largest scale <a href="http://vcg.seas.harvard.edu/publications/what-makes-visualization-memorable" rel="nofollow external" class="bo">visualization study</a> to date,” they asked, “What Makes a Visualization Memorable?”</p> <p> </p> <h1>Caveat</h1> <p>Memorability is very important, but still just half the recipe.</p> <p>The researches did not look at how well viewers <em>understood</em> the images, just how well they remembered them. Borkin’s next steps are to measure comprehension: that new study is already in progress.</p> <p>This study represents the first step in their research, as they explore what makes an effective infographic, but it already raises questions about what designers have believed so far.</p> <p> </p> <h1>What they did</h1> <p>First, the team created a “visual taxonomy” of the images, identifying them by qualities like chart types, number of colors and presence of human-recognizable objects. They also classified attributes like the presence of non-essential decoration and “visual density” (a.k.a. clutter).</p> <p><a href="http://netdna.webdesignerdepot.com/uploads/2014/03/0021.jpg" rel="nofollow external" class="bo"><img src="http://netdna.webdesignerdepot.com/uploads/2014/03/0021.jpg" width="650" alt="Intriguing study reveals the secrets of successful infographics" style="max-width: 100%; height: auto;"></a></p> <p><em>“Redesign Your Place” infographic designed for DMC Bologna, by Jacopo Ferretti</em></p> <p>Then they chose 410 images that evenly represented the range of their sources (like news, science and the infographics site, <a href="http://visual.ly" rel="nofollow external" class="bo">visual.ly</a>) as well as the range of qualities they’d identified. Using that group, they ran an online experiment (using Amazon’s <a href="https://www.mturk.com/mturk/welcome" rel="nofollow external" class="bo">Mechanical Turk</a>) in which participants watched a stream of images and clicked a button whenever they saw one they believed had been shown before.</p> <p> </p> <h1>What they learned</h1> <p>To the surprise of the researchers, bar graphs and charts did poorly. It turns out (news flash) they all kinda look the same. The most memorable images contained “human recognizable objects.” Think mundane stuff like photos or illustrations of bottles, animals and shoes, not to mention people.</p> <p><a href="http://netdna.webdesignerdepot.com/uploads/2014/03/0011.jpg" rel="nofollow external" class="bo"><img src="http://netdna.webdesignerdepot.com/uploads/2014/03/0011.jpg" width="650" alt="Intriguing study reveals the secrets of successful infographics" style="max-width: 100%; height: auto;"></a></p> <p><em>“Who is Occupy Wall Street” infographic created for Fast Company, by Jess3</em></p> <p>Other important points:</p> <ol> <li>Color made a huge difference: the more, the better.</li> <li>Images with more clutter were highly memorable. How much more memorable? <em>A lot.</em>
    </li> <li>Images with lots of circles and rounded corner graphics also ranked high.</li> </ol> <p> </p> <h1>More about clutter</h1> <p>Plenty of psychology lab studies show that simple and clear visualizations are easier to understand. However, researchers have also found that “chart junk” (a term coined by Edward Tufte, so important it gets its own <a href="http://en.wikipedia.org/wiki/Chartjunk" rel="nofollow external" class="bo">Wikipedia entry</a>) can improve retention because it forces us to work harder at understanding a graph, resulting in better comprehension.</p> <p>Again, understanding what makes an infographic memorable is only the first step to creating more effective presentations. According to Borkin, “Making a visualization more memorable means making some part of the visualization ‘stick’ in the viewer’s mind.” She emphasizes that we also need to learn how to make sure that what sticks is our intended message, and not the eye candy.</p> <p><br><br> </p>
    <table width="100%"> <tbody>
    <tr> <td> <a href="http://www.mightydeals.com/deal/startupvitamins.html?ref=inwidget" rel="nofollow external" class="bo"><strong>The Only Motivational Startup Posters You’ll Ever Need – only $18!</strong></a> </td> <td> <a href="http://www.mightydeals.com/?ref=inwidget" rel="nofollow external" class="bo"><br> <img src="http://mightydeals.com/web/images/widget-logo.png" height="40" width="90" alt="Intriguing study reveals the secrets of successful infographics" style="max-width: 100%; height: auto;"><br> </a> </td> </tr> </tbody>
    </table> <p><br> </p> <a href="http://www.webdesignerdepot.com/2014/03/intriguing-study-reveals-the-secrets-of-successful-infographics/" rel="nofollow external" class="bo">Source</a> <br><div><table border="0"><tbody><tr><td>
    <a href="http://share.feedsportal.com/share/twitter/?u=http%3A%2F%2Fwww.webdesignerdepot.com%2F2014%2F03%2Fintriguing-study-reveals-the-secrets-of-successful-infographics%2F&amp;t=Intriguing+study+reveals+the+secrets+of+successful+infographics" rel="nofollow external" class="bo"><img src="http://res3.feedsportal.com/social/twitter.png" style="max-width: 100%; height: auto;"></a> <a href="http://share.feedsportal.com/share/facebook/?u=http%3A%2F%2Fwww.webdesignerdepot.com%2F2014%2F03%2Fintriguing-study-reveals-the-secrets-of-successful-infographics%2F&amp;t=Intriguing+study+reveals+the+secrets+of+successful+infographics" rel="nofollow external" class="bo"><img src="http://res3.feedsportal.com/social/facebook.png" style="max-width: 100%; height: auto;"></a> <a href="http://share.feedsportal.com/share/linkedin/?u=http%3A%2F%2Fwww.webdesignerdepot.com%2F2014%2F03%2Fintriguing-study-reveals-the-secrets-of-successful-infographics%2F&amp;t=Intriguing+study+reveals+the+secrets+of+successful+infographics" rel="nofollow external" class="bo"><img src="http://res3.feedsportal.com/social/linkedin.png" style="max-width: 100%; height: auto;"></a> <a href="http://share.feedsportal.com/share/gplus/?u=http%3A%2F%2Fwww.webdesignerdepot.com%2F2014%2F03%2Fintriguing-study-reveals-the-secrets-of-successful-infographics%2F&amp;t=Intriguing+study+reveals+the+secrets+of+successful+infographics" rel="nofollow external" class="bo"><img src="http://res3.feedsportal.com/social/googleplus.png" style="max-width: 100%; height: auto;"></a> <a href="http://share.feedsportal.com/share/email/?u=http%3A%2F%2Fwww.webdesignerdepot.com%2F2014%2F03%2Fintriguing-study-reveals-the-secrets-of-successful-infographics%2F&amp;t=Intriguing+study+reveals+the+secrets+of+successful+infographics" rel="nofollow external" class="bo"><img src="http://res3.feedsportal.com/social/email.png" style="max-width: 100%; height: auto;"></a>
    </td></tr></tbody></table></div>
    <br><br><a href="http://da.feedsportal.com/r/191801326156/u/49/f/661066/c/35285/s/38082be8/sc/4/rc/1/rc.htm" rel="nofollow external" class="bo"><img src="http://da.feedsportal.com/r/191801326156/u/49/f/661066/c/35285/s/38082be8/sc/4/rc/1/rc.img" style="max-width: 100%; height: auto;"></a><br><a href="http://da.feedsportal.com/r/191801326156/u/49/f/661066/c/35285/s/38082be8/sc/4/rc/2/rc.htm" rel="nofollow external" class="bo"><img src="http://da.feedsportal.com/r/191801326156/u/49/f/661066/c/35285/s/38082be8/sc/4/rc/2/rc.img" style="max-width: 100%; height: auto;"></a><br><a href="http://da.feedsportal.com/r/191801326156/u/49/f/661066/c/35285/s/38082be8/sc/4/rc/3/rc.htm" rel="nofollow external" class="bo"><img src="http://da.feedsportal.com/r/191801326156/u/49/f/661066/c/35285/s/38082be8/sc/4/rc/3/rc.img" style="max-width: 100%; height: auto;"></a><br><br><a href="http://da.feedsportal.com/r/191801326156/u/49/f/661066/c/35285/s/38082be8/a2.htm" rel="nofollow external" class="bo"><img src="http://da.feedsportal.com/r/191801326156/u/49/f/661066/c/35285/s/38082be8/a2.img" style="max-width: 100%; height: auto;"></a>
    </div>
]]>
</Body>
<Summary>What makes an infographic successful? As designers, we want it to achieve a balance of two main things:     Did the reader get the message we wanted them to get?   Was the message memorable?...</Summary>
<Website>http://rss.feedsportal.com/c/35285/f/661066/s/38082be8/sc/4/l/0L0Swebdesignerdepot0N0C20A140C0A30Cintriguing0Estudy0Ereveals0Ethe0Esecrets0Eof0Esuccessful0Einfographics0C/story01.htm</Website>
<TrackingUrl>https://my3.my.umbc.edu/api/v0/pixel/news/42286/guest@my.umbc.edu/9d3c08ba30872c974ea0864ee06f1249/api/pixel</TrackingUrl>
<Tag>art</Tag>
<Tag>cool-infographics</Tag>
<Tag>css</Tag>
<Tag>design</Tag>
<Tag>designing-an-infographic</Tag>
<Tag>development</Tag>
<Tag>html</Tag>
<Tag>html5</Tag>
<Tag>illustrator</Tag>
<Tag>infographics</Tag>
<Tag>javascript</Tag>
<Tag>marketing</Tag>
<Tag>mysql</Tag>
<Tag>oracle</Tag>
<Tag>photoshop</Tag>
<Tag>php</Tag>
<Tag>rules-of-infographics</Tag>
<Tag>sql</Tag>
<Tag>successful-infographic</Tag>
<Group token="retired-583">Web Developer - Build Group</Group>
<GroupUrl>https://my3.my.umbc.edu/groups/retired-583</GroupUrl>
<AvatarUrl>https://assets3-my.umbc.edu/system/shared/avatars/groups/000/000/583/fc60f5d7abc2e080599bb6dc465db54d/xsmall.png?1363101197</AvatarUrl>
<AvatarUrl size="original">https://assets4-my.umbc.edu/system/shared/avatars/groups/000/000/583/fc60f5d7abc2e080599bb6dc465db54d/original.jpg?1363101197</AvatarUrl>
<AvatarUrl size="xxlarge">https://assets4-my.umbc.edu/system/shared/avatars/groups/000/000/583/fc60f5d7abc2e080599bb6dc465db54d/xxlarge.png?1363101197</AvatarUrl>
<AvatarUrl size="xlarge">https://assets4-my.umbc.edu/system/shared/avatars/groups/000/000/583/fc60f5d7abc2e080599bb6dc465db54d/xlarge.png?1363101197</AvatarUrl>
<AvatarUrl size="large">https://assets3-my.umbc.edu/system/shared/avatars/groups/000/000/583/fc60f5d7abc2e080599bb6dc465db54d/large.png?1363101197</AvatarUrl>
<AvatarUrl size="medium">https://assets3-my.umbc.edu/system/shared/avatars/groups/000/000/583/fc60f5d7abc2e080599bb6dc465db54d/medium.png?1363101197</AvatarUrl>
<AvatarUrl size="small">https://assets4-my.umbc.edu/system/shared/avatars/groups/000/000/583/fc60f5d7abc2e080599bb6dc465db54d/small.png?1363101197</AvatarUrl>
<AvatarUrl size="xsmall">https://assets3-my.umbc.edu/system/shared/avatars/groups/000/000/583/fc60f5d7abc2e080599bb6dc465db54d/xsmall.png?1363101197</AvatarUrl>
<AvatarUrl size="xxsmall">https://assets4-my.umbc.edu/system/shared/avatars/groups/000/000/583/fc60f5d7abc2e080599bb6dc465db54d/xxsmall.png?1363101197</AvatarUrl>
<Sponsor>Web Developer - Build Group</Sponsor>
<PawCount>0</PawCount>
<CommentCount>0</CommentCount>
<CommentsAllowed>true</CommentsAllowed>
<PostedAt>Tue, 11 Mar 2014 04:15:23 -0400</PostedAt>
<EditAt>Tue, 11 Mar 2014 04:15:23 -0400</EditAt>
</NewsItem>

<NewsItem contentIssues="false" id="42285" important="false" status="posted" url="https://my3.my.umbc.edu/posts/42285">
<Title>talk: Scalable monitoring &amp; kernel learning for energy grids, Noon Thr 3/13</Title>
<Body>
<![CDATA[
    <div class="html-content">
    <p><img alt="http://images.cdn.fotopedia.com/flickr-8270003222-hd.jpg" src="http://www.csee.umbc.edu/wp-content/uploads/2014/03/flickr-8270003222-hd.jpg" width="700" height="308" style="max-width: 100%; height: auto;"></p>
    <h2>Scalable monitoring and kernel learning for energy grids</h2>
    <h3>Vassilis Kekatos<br>
    Department of Electrical and Computer Engineering<br>
    University of Minnesota</h3>
    <h3>12:00pm-1:00pm, Thursday, 13 March 2014, ITE 325b, UMBC</h3>
    <p>The smart grid vision urges for enhanced situational awareness, sustainability, and economics over our energy systems. While meters are being installed throughout the grid, algorithms that can effectively process this big data deluge are now demanded. Aligned to that end, this talk focuses first on scalable grid monitoring. Albeit control centers monitor their local grids independently, deregulation and renewables call for power system state estimation (PSSE) at the interconnection level. To address the complexity and communication challenges involved, a decentralized PSSE framework based on the alternating direction method of multipliers has been developed. Beyond conventional least-squares, our framework can identify outliers and circuit breaker statuses as verified on IEEE grids having thousands of nodes. Electricity market inference is the second theme of this talk. We will first demonstrate how grid topologies can be revealed using only publicly available real-time energy prices. This becomes feasible after recognizing that the price matrix can be factorized as the product of the grid Laplacian times a low-rank and sparse matrix. Leveraging the link between energy markets and the underlying physical grids, we will then cast day-ahead price forecasting as a kernel learning task. Through a novel nuclear norm-based regularization, kernels across pricing nodes and hours are systematically selected. Numerical tests using real data from the Midwest ISO market corroborate the interpretative merits of our schemes.</p>
    <p>Dr. <a href="http://www.tc.umn.edu/~kekatos/" rel="nofollow external" class="bo">Vassilis Kekatos</a> is currently a postdoctoral associate with the ECE Dept. of the University of Minnesota, Minneapolis. He obtained his Ph.D. in Computer Engineering and Science from the University of Patras, Greece, in 2007. In 2009, he received a Marie Curie fellowship. During the summer of 2012, he worked as a consultant for Windlogics Inc. His current interests lie in the areas of signal processing, optimization, and statistical learning towards modernizing our energy systems.</p>
    <p>Host: Tulay Adali</p>
    </div>
]]>
</Body>
<Summary>Scalable monitoring and kernel learning for energy grids   Vassilis Kekatos  Department of Electrical and Computer Engineering  University of Minnesota   12:00pm-1:00pm, Thursday, 13 March 2014,...</Summary>
<Website>http://www.csee.umbc.edu/2014/03/talk-scalable-monitoring-kernel-learning-for-energy-grids-noon-thr-313/</Website>
<TrackingUrl>https://my3.my.umbc.edu/api/v0/pixel/news/42285/guest@my.umbc.edu/7d1c0e7c4861a97d4cf250f06e5a7450/api/pixel</TrackingUrl>
<Tag>computer-engineering</Tag>
<Tag>news</Tag>
<Tag>research</Tag>
<Tag>talks</Tag>
<Group token="csee">Computer Science and Electrical Engineering</Group>
<GroupUrl>https://my3.my.umbc.edu/groups/csee</GroupUrl>
<AvatarUrl>https://assets3-my.umbc.edu/system/shared/avatars/groups/000/000/099/d117dca133c64bf78a4b7696dd007189/xsmall.png?1314043393</AvatarUrl>
<AvatarUrl size="original">https://assets1-my.umbc.edu/system/shared/avatars/groups/000/000/099/d117dca133c64bf78a4b7696dd007189/original.png?1314043393</AvatarUrl>
<AvatarUrl size="xxlarge">https://assets1-my.umbc.edu/system/shared/avatars/groups/000/000/099/d117dca133c64bf78a4b7696dd007189/xxlarge.png?1314043393</AvatarUrl>
<AvatarUrl size="xlarge">https://assets4-my.umbc.edu/system/shared/avatars/groups/000/000/099/d117dca133c64bf78a4b7696dd007189/xlarge.png?1314043393</AvatarUrl>
<AvatarUrl size="large">https://assets3-my.umbc.edu/system/shared/avatars/groups/000/000/099/d117dca133c64bf78a4b7696dd007189/large.png?1314043393</AvatarUrl>
<AvatarUrl size="medium">https://assets1-my.umbc.edu/system/shared/avatars/groups/000/000/099/d117dca133c64bf78a4b7696dd007189/medium.png?1314043393</AvatarUrl>
<AvatarUrl size="small">https://assets2-my.umbc.edu/system/shared/avatars/groups/000/000/099/d117dca133c64bf78a4b7696dd007189/small.png?1314043393</AvatarUrl>
<AvatarUrl size="xsmall">https://assets3-my.umbc.edu/system/shared/avatars/groups/000/000/099/d117dca133c64bf78a4b7696dd007189/xsmall.png?1314043393</AvatarUrl>
<AvatarUrl size="xxsmall">https://assets3-my.umbc.edu/system/shared/avatars/groups/000/000/099/d117dca133c64bf78a4b7696dd007189/xxsmall.png?1314043393</AvatarUrl>
<Sponsor>Computer Science and Electrical Engineering</Sponsor>
<PawCount>0</PawCount>
<CommentCount>0</CommentCount>
<CommentsAllowed>true</CommentsAllowed>
<PostedAt>Mon, 10 Mar 2014 23:23:31 -0400</PostedAt>
</NewsItem>

<NewsItem contentIssues="false" id="42612" important="false" status="posted" url="https://my3.my.umbc.edu/posts/42612">
<Title>talk: Scalable monitoring &amp; kernel learning for energy grids, Noon Thr 3/13</Title>
<Body>
<![CDATA[
    <div class="html-content">
    <p><img alt="http://images.cdn.fotopedia.com/flickr-8270003222-hd.jpg" src="http://www.csee.umbc.edu/wp-content/uploads/2014/03/flickr-8270003222-hd.jpg" width="700" height="308" style="max-width: 100%; height: auto;"></p>
    <h2>Scalable monitoring and kernel learning for energy grids</h2>
    <h3>Vassilis Kekatos<br>
    Department of Electrical and Computer Engineering<br>
    University of Minnesota</h3>
    <h3>12:00pm-1:00pm, Thursday, 13 March 2014, ITE 325b, UMBC</h3>
    <p>The smart grid vision urges for enhanced situational awareness, sustainability, and economics over our energy systems. While meters are being installed throughout the grid, algorithms that can effectively process this big data deluge are now demanded. Aligned to that end, this talk focuses first on scalable grid monitoring. Albeit control centers monitor their local grids independently, deregulation and renewables call for power system state estimation (PSSE) at the interconnection level. To address the complexity and communication challenges involved, a decentralized PSSE framework based on the alternating direction method of multipliers has been developed. Beyond conventional least-squares, our framework can identify outliers and circuit breaker statuses as verified on IEEE grids having thousands of nodes. Electricity market inference is the second theme of this talk. We will first demonstrate how grid topologies can be revealed using only publicly available real-time energy prices. This becomes feasible after recognizing that the price matrix can be factorized as the product of the grid Laplacian times a low-rank and sparse matrix. Leveraging the link between energy markets and the underlying physical grids, we will then cast day-ahead price forecasting as a kernel learning task. Through a novel nuclear norm-based regularization, kernels across pricing nodes and hours are systematically selected. Numerical tests using real data from the Midwest ISO market corroborate the interpretative merits of our schemes.</p>
    <p>Dr. <a href="http://www.tc.umn.edu/~kekatos/" rel="nofollow external" class="bo">Vassilis Kekatos</a> is currently a postdoctoral associate with the ECE Dept. of the University of Minnesota, Minneapolis. He obtained his Ph.D. in Computer Engineering and Science from the University of Patras, Greece, in 2007. In 2009, he received a Marie Curie fellowship. During the summer of 2012, he worked as a consultant for Windlogics Inc. His current interests lie in the areas of signal processing, optimization, and statistical learning towards modernizing our energy systems.</p>
    <p>Host: Tulay Adali</p>
    </div>
]]>
</Body>
<Summary>Scalable monitoring and kernel learning for energy grids   Vassilis Kekatos  Department of Electrical and Computer Engineering  University of Minnesota   12:00pm-1:00pm, Thursday, 13 March 2014,...</Summary>
<Website>http://www.csee.umbc.edu/2014/03/talk-scalable-monitoring-kernel-learning-for-energy-grids-noon-thr-313/?utm_source=rss&amp;utm_medium=rss&amp;utm_campaign=talk-scalable-monitoring-kernel-learning-for-energy-grids-noon-thr-313</Website>
<TrackingUrl>https://my3.my.umbc.edu/api/v0/pixel/news/42612/guest@my.umbc.edu/e6f20cc39553c9528f5046a7bc6db533/api/pixel</TrackingUrl>
<Tag>computer-engineering</Tag>
<Tag>news</Tag>
<Tag>research</Tag>
<Tag>talks</Tag>
<Group token="csee">Computer Science and Electrical Engineering</Group>
<GroupUrl>https://my3.my.umbc.edu/groups/csee</GroupUrl>
<AvatarUrl>https://assets3-my.umbc.edu/system/shared/avatars/groups/000/000/099/d117dca133c64bf78a4b7696dd007189/xsmall.png?1314043393</AvatarUrl>
<AvatarUrl size="original">https://assets1-my.umbc.edu/system/shared/avatars/groups/000/000/099/d117dca133c64bf78a4b7696dd007189/original.png?1314043393</AvatarUrl>
<AvatarUrl size="xxlarge">https://assets1-my.umbc.edu/system/shared/avatars/groups/000/000/099/d117dca133c64bf78a4b7696dd007189/xxlarge.png?1314043393</AvatarUrl>
<AvatarUrl size="xlarge">https://assets4-my.umbc.edu/system/shared/avatars/groups/000/000/099/d117dca133c64bf78a4b7696dd007189/xlarge.png?1314043393</AvatarUrl>
<AvatarUrl size="large">https://assets3-my.umbc.edu/system/shared/avatars/groups/000/000/099/d117dca133c64bf78a4b7696dd007189/large.png?1314043393</AvatarUrl>
<AvatarUrl size="medium">https://assets1-my.umbc.edu/system/shared/avatars/groups/000/000/099/d117dca133c64bf78a4b7696dd007189/medium.png?1314043393</AvatarUrl>
<AvatarUrl size="small">https://assets2-my.umbc.edu/system/shared/avatars/groups/000/000/099/d117dca133c64bf78a4b7696dd007189/small.png?1314043393</AvatarUrl>
<AvatarUrl size="xsmall">https://assets3-my.umbc.edu/system/shared/avatars/groups/000/000/099/d117dca133c64bf78a4b7696dd007189/xsmall.png?1314043393</AvatarUrl>
<AvatarUrl size="xxsmall">https://assets3-my.umbc.edu/system/shared/avatars/groups/000/000/099/d117dca133c64bf78a4b7696dd007189/xxsmall.png?1314043393</AvatarUrl>
<Sponsor>Computer Science and Electrical Engineering</Sponsor>
<PawCount>0</PawCount>
<CommentCount>0</CommentCount>
<CommentsAllowed>true</CommentsAllowed>
<PostedAt>Mon, 10 Mar 2014 23:23:31 -0400</PostedAt>
</NewsItem>

<NewsItem contentIssues="true" id="42299" important="false" status="posted" url="https://my3.my.umbc.edu/posts/42299">
<Title>Daunting Tests Await Admiral Named N.S.A. Chief</Title>
<Body>
<![CDATA[
    <div class="html-content">Vice Adm. Michael S. Rogers, who currently runs the Navy’s Fleet Cyber Command, has been appointed to navigate a bureaucratic, political and public relations disaster.<br><div><table border="0"><tbody><tr><td>
    <a href="http://share.feedsportal.com/share/twitter/?u=http%3A%2F%2Fwww.nytimes.com%2F2014%2F03%2F11%2Fworld%2Fadmiral-set-to-face-confirmation-to-lead-nsa.html%3Fpartner%3Drss%26emc%3Drss&amp;t=Daunting+Tests+Await+Admiral+Named+N.S.A.+Chief" rel="nofollow external" class="bo"><img src="http://res3.feedsportal.com/social/twitter.png" style="max-width: 100%; height: auto;"></a> <a href="http://share.feedsportal.com/share/facebook/?u=http%3A%2F%2Fwww.nytimes.com%2F2014%2F03%2F11%2Fworld%2Fadmiral-set-to-face-confirmation-to-lead-nsa.html%3Fpartner%3Drss%26emc%3Drss&amp;t=Daunting+Tests+Await+Admiral+Named+N.S.A.+Chief" rel="nofollow external" class="bo"><img src="http://res3.feedsportal.com/social/facebook.png" style="max-width: 100%; height: auto;"></a> <a href="http://share.feedsportal.com/share/linkedin/?u=http%3A%2F%2Fwww.nytimes.com%2F2014%2F03%2F11%2Fworld%2Fadmiral-set-to-face-confirmation-to-lead-nsa.html%3Fpartner%3Drss%26emc%3Drss&amp;t=Daunting+Tests+Await+Admiral+Named+N.S.A.+Chief" rel="nofollow external" class="bo"><img src="http://res3.feedsportal.com/social/linkedin.png" style="max-width: 100%; height: auto;"></a> <a href="http://share.feedsportal.com/share/gplus/?u=http%3A%2F%2Fwww.nytimes.com%2F2014%2F03%2F11%2Fworld%2Fadmiral-set-to-face-confirmation-to-lead-nsa.html%3Fpartner%3Drss%26emc%3Drss&amp;t=Daunting+Tests+Await+Admiral+Named+N.S.A.+Chief" rel="nofollow external" class="bo"><img src="http://res3.feedsportal.com/social/googleplus.png" style="max-width: 100%; height: auto;"></a> <a href="http://share.feedsportal.com/share/email/?u=http%3A%2F%2Fwww.nytimes.com%2F2014%2F03%2F11%2Fworld%2Fadmiral-set-to-face-confirmation-to-lead-nsa.html%3Fpartner%3Drss%26emc%3Drss&amp;t=Daunting+Tests+Await+Admiral+Named+N.S.A.+Chief" rel="nofollow external" class="bo"><img src="http://res3.feedsportal.com/social/email.png" style="max-width: 100%; height: auto;"></a>
    </td></tr></tbody></table></div>
    </div>
]]>
</Body>
<Summary>Vice Adm. Michael S. Rogers, who currently runs the Navy’s Fleet Cyber Command, has been appointed to navigate a bureaucratic, political and public relations disaster.      </Summary>
<Website>http://rss.nytimes.com/c/34625/f/640387/s/380bd95d/sc/1/l/0L0Snytimes0N0C20A140C0A30C110Cworld0Cadmiral0Eset0Eto0Eface0Econfirmation0Eto0Elead0Ensa0Bhtml0Dpartner0Frss0Gemc0Frss/story01.htm</Website>
<TrackingUrl>https://my3.my.umbc.edu/api/v0/pixel/news/42299/guest@my.umbc.edu/883ceb9e4d96444397a4544126fbd8ca/api/pixel</TrackingUrl>
<Tag>classified-information-and-state-secrets</Tag>
<Tag>computers-and-the-internet</Tag>
<Tag>google-inc-goog-nasdaq</Tag>
<Tag>microsoft-corporation-msft-nasdaq</Tag>
<Tag>national-security-agency</Tag>
<Tag>new</Tag>
<Tag>obama-barack</Tag>
<Tag>rogers-michael-s</Tag>
<Tag>snowden-edward-j</Tag>
<Tag>surveillance-of-citizens-by-government</Tag>
<Tag>technology</Tag>
<Tag>united-states</Tag>
<Tag>united-states-defense-and-military-forces</Tag>
<Tag>united-states-politics-and-government</Tag>
<Tag>yahoo-inc-yhoo-nasdaq</Tag>
<Tag>york</Tag>
<Group token="retired-583">Web Developer - Build Group</Group>
<GroupUrl>https://my3.my.umbc.edu/groups/retired-583</GroupUrl>
<AvatarUrl>https://assets3-my.umbc.edu/system/shared/avatars/groups/000/000/583/fc60f5d7abc2e080599bb6dc465db54d/xsmall.png?1363101197</AvatarUrl>
<AvatarUrl size="original">https://assets4-my.umbc.edu/system/shared/avatars/groups/000/000/583/fc60f5d7abc2e080599bb6dc465db54d/original.jpg?1363101197</AvatarUrl>
<AvatarUrl size="xxlarge">https://assets4-my.umbc.edu/system/shared/avatars/groups/000/000/583/fc60f5d7abc2e080599bb6dc465db54d/xxlarge.png?1363101197</AvatarUrl>
<AvatarUrl size="xlarge">https://assets4-my.umbc.edu/system/shared/avatars/groups/000/000/583/fc60f5d7abc2e080599bb6dc465db54d/xlarge.png?1363101197</AvatarUrl>
<AvatarUrl size="large">https://assets3-my.umbc.edu/system/shared/avatars/groups/000/000/583/fc60f5d7abc2e080599bb6dc465db54d/large.png?1363101197</AvatarUrl>
<AvatarUrl size="medium">https://assets3-my.umbc.edu/system/shared/avatars/groups/000/000/583/fc60f5d7abc2e080599bb6dc465db54d/medium.png?1363101197</AvatarUrl>
<AvatarUrl size="small">https://assets4-my.umbc.edu/system/shared/avatars/groups/000/000/583/fc60f5d7abc2e080599bb6dc465db54d/small.png?1363101197</AvatarUrl>
<AvatarUrl size="xsmall">https://assets3-my.umbc.edu/system/shared/avatars/groups/000/000/583/fc60f5d7abc2e080599bb6dc465db54d/xsmall.png?1363101197</AvatarUrl>
<AvatarUrl size="xxsmall">https://assets4-my.umbc.edu/system/shared/avatars/groups/000/000/583/fc60f5d7abc2e080599bb6dc465db54d/xxsmall.png?1363101197</AvatarUrl>
<Sponsor>Web Developer - Build Group</Sponsor>
<PawCount>0</PawCount>
<CommentCount>0</CommentCount>
<CommentsAllowed>true</CommentsAllowed>
<PostedAt>Mon, 10 Mar 2014 22:17:18 -0400</PostedAt>
</NewsItem>

<NewsItem contentIssues="false" id="42280" important="false" status="posted" url="https://my3.my.umbc.edu/posts/42280">
<Title>Prof. desJardins interviewed in VOA story on Int. Women&#8217;s Day</Title>
<Body>
<![CDATA[
    <div class="html-content">
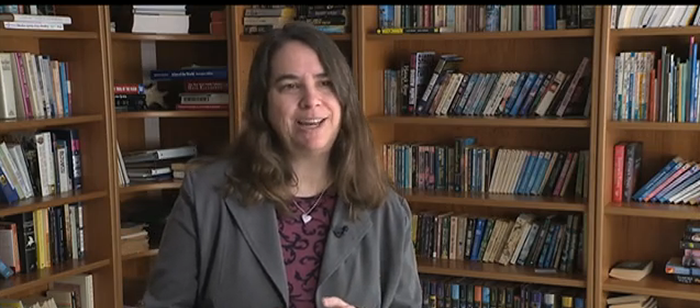
    <p><img alt="UMBC Professor Marie desJardins" src="http://www.csee.umbc.edu/wp-content/uploads/2014/03/mdj.png" width="700" height="308" style="max-width: 100%; height: auto;"><br>
     </p>
    <p>CSEE professor Marie desJardins was interviewed for a story, <a href="http://www.voanews.com/content/education-key-theme-for-international-womens-day/1866669.html" rel="nofollow external" class="bo">Education Key Theme for International Women’s Day</a>, by the Voice of America on International Women’s Day (March 8).</p>
    <blockquote>
    <p> “If you look at the statistics, well over half of all STEM jobs in the next 10 to 15 years are in computing … yet when people talk about STEM, they tend to think about biology, physics,” said University of Maryland Baltimore County Professor Marie Desjardins who teaches computer science and engineering. “Those are great areas, but those are not where the big job growth is going to be.”</p>
    <p>DesJardins also says exposing kids at an early age is key to getting them interested in STEM.</p>
    <p>“Let your girls try things that are not typically girly,” she said. “Make sure your kids are getting that from an early age so they think of themselves as creators of technology and new ideas not just following the rules.”</p>
    <p>DesJardins says she emphasizes that computer science is really about helping make the world a better place.  </p>
    </blockquote>
    <p>Here is the video that accompanied the VIA story.</p>
    <br><br>
    See Dr. desJardins in the segment from 1:25-2:19</div>
]]>
</Body>
<Summary>    CSEE professor Marie desJardins was interviewed for a story, Education Key Theme for International Women’s Day, by the Voice of America on International Women’s Day (March 8).     “If you look...</Summary>
<Website>http://www.csee.umbc.edu/2014/03/prof-desjardins-interviewed-for-voa-story-on-int-womens-day/</Website>
<TrackingUrl>https://my3.my.umbc.edu/api/v0/pixel/news/42280/guest@my.umbc.edu/c6ee4d2ef69a04bf0509a76f385c37cf/api/pixel</TrackingUrl>
<Tag>faculty-and-staff</Tag>
<Tag>news</Tag>
<Group token="csee">Computer Science and Electrical Engineering</Group>
<GroupUrl>https://my3.my.umbc.edu/groups/csee</GroupUrl>
<AvatarUrl>https://assets3-my.umbc.edu/system/shared/avatars/groups/000/000/099/d117dca133c64bf78a4b7696dd007189/xsmall.png?1314043393</AvatarUrl>
<AvatarUrl size="original">https://assets1-my.umbc.edu/system/shared/avatars/groups/000/000/099/d117dca133c64bf78a4b7696dd007189/original.png?1314043393</AvatarUrl>
<AvatarUrl size="xxlarge">https://assets1-my.umbc.edu/system/shared/avatars/groups/000/000/099/d117dca133c64bf78a4b7696dd007189/xxlarge.png?1314043393</AvatarUrl>
<AvatarUrl size="xlarge">https://assets4-my.umbc.edu/system/shared/avatars/groups/000/000/099/d117dca133c64bf78a4b7696dd007189/xlarge.png?1314043393</AvatarUrl>
<AvatarUrl size="large">https://assets3-my.umbc.edu/system/shared/avatars/groups/000/000/099/d117dca133c64bf78a4b7696dd007189/large.png?1314043393</AvatarUrl>
<AvatarUrl size="medium">https://assets1-my.umbc.edu/system/shared/avatars/groups/000/000/099/d117dca133c64bf78a4b7696dd007189/medium.png?1314043393</AvatarUrl>
<AvatarUrl size="small">https://assets2-my.umbc.edu/system/shared/avatars/groups/000/000/099/d117dca133c64bf78a4b7696dd007189/small.png?1314043393</AvatarUrl>
<AvatarUrl size="xsmall">https://assets3-my.umbc.edu/system/shared/avatars/groups/000/000/099/d117dca133c64bf78a4b7696dd007189/xsmall.png?1314043393</AvatarUrl>
<AvatarUrl size="xxsmall">https://assets3-my.umbc.edu/system/shared/avatars/groups/000/000/099/d117dca133c64bf78a4b7696dd007189/xxsmall.png?1314043393</AvatarUrl>
<Sponsor>Computer Science and Electrical Engineering</Sponsor>
<PawCount>2</PawCount>
<CommentCount>0</CommentCount>
<CommentsAllowed>true</CommentsAllowed>
<PostedAt>Mon, 10 Mar 2014 22:15:47 -0400</PostedAt>
</NewsItem>

<NewsItem contentIssues="false" id="42613" important="false" status="posted" url="https://my3.my.umbc.edu/posts/42613">
<Title>Prof. desJardins interviewed in VOA story on Int. Women&#8217;s Day</Title>
<Body>
<![CDATA[
    <div class="html-content">
    <p><img alt="UMBC Professor Marie desJardins" src="http://www.csee.umbc.edu/wp-content/uploads/2014/03/mdj.png" width="700" height="308" style="max-width: 100%; height: auto;"><br>
     </p>
    <p>CSEE professor Marie desJardins was interviewed for a story, <a href="http://www.voanews.com/content/education-key-theme-for-international-womens-day/1866669.html" rel="nofollow external" class="bo">Education Key Theme for International Women’s Day</a>, by the Voice of America on International Women’s Day (March 8).</p>
    <blockquote>
    <p> “If you look at the statistics, well over half of all STEM jobs in the next 10 to 15 years are in computing … yet when people talk about STEM, they tend to think about biology, physics,” said University of Maryland Baltimore County Professor Marie Desjardins who teaches computer science and engineering. “Those are great areas, but those are not where the big job growth is going to be.”</p>
    <p>DesJardins also says exposing kids at an early age is key to getting them interested in STEM.</p>
    <p>“Let your girls try things that are not typically girly,” she said. “Make sure your kids are getting that from an early age so they think of themselves as creators of technology and new ideas not just following the rules.”</p>
    <p>DesJardins says she emphasizes that computer science is really about helping make the world a better place.  </p>
    </blockquote>
    <p>Here is the video that accompanied the VIA story.</p>
    <br><br>
    See Dr. desJardins in the segment from 1:25-2:19</div>
]]>
</Body>
<Summary>    CSEE professor Marie desJardins was interviewed for a story, Education Key Theme for International Women’s Day, by the Voice of America on International Women’s Day (March 8).     “If you look...</Summary>
<Website>http://www.csee.umbc.edu/2014/03/prof-desjardins-interviewed-for-voa-story-on-int-womens-day/?utm_source=rss&amp;utm_medium=rss&amp;utm_campaign=prof-desjardins-interviewed-for-voa-story-on-int-womens-day</Website>
<TrackingUrl>https://my3.my.umbc.edu/api/v0/pixel/news/42613/guest@my.umbc.edu/b202107a99ef93e2f9f90a4cea6fed1b/api/pixel</TrackingUrl>
<Tag>faculty-and-staff</Tag>
<Tag>news</Tag>
<Group token="csee">Computer Science and Electrical Engineering</Group>
<GroupUrl>https://my3.my.umbc.edu/groups/csee</GroupUrl>
<AvatarUrl>https://assets3-my.umbc.edu/system/shared/avatars/groups/000/000/099/d117dca133c64bf78a4b7696dd007189/xsmall.png?1314043393</AvatarUrl>
<AvatarUrl size="original">https://assets1-my.umbc.edu/system/shared/avatars/groups/000/000/099/d117dca133c64bf78a4b7696dd007189/original.png?1314043393</AvatarUrl>
<AvatarUrl size="xxlarge">https://assets1-my.umbc.edu/system/shared/avatars/groups/000/000/099/d117dca133c64bf78a4b7696dd007189/xxlarge.png?1314043393</AvatarUrl>
<AvatarUrl size="xlarge">https://assets4-my.umbc.edu/system/shared/avatars/groups/000/000/099/d117dca133c64bf78a4b7696dd007189/xlarge.png?1314043393</AvatarUrl>
<AvatarUrl size="large">https://assets3-my.umbc.edu/system/shared/avatars/groups/000/000/099/d117dca133c64bf78a4b7696dd007189/large.png?1314043393</AvatarUrl>
<AvatarUrl size="medium">https://assets1-my.umbc.edu/system/shared/avatars/groups/000/000/099/d117dca133c64bf78a4b7696dd007189/medium.png?1314043393</AvatarUrl>
<AvatarUrl size="small">https://assets2-my.umbc.edu/system/shared/avatars/groups/000/000/099/d117dca133c64bf78a4b7696dd007189/small.png?1314043393</AvatarUrl>
<AvatarUrl size="xsmall">https://assets3-my.umbc.edu/system/shared/avatars/groups/000/000/099/d117dca133c64bf78a4b7696dd007189/xsmall.png?1314043393</AvatarUrl>
<AvatarUrl size="xxsmall">https://assets3-my.umbc.edu/system/shared/avatars/groups/000/000/099/d117dca133c64bf78a4b7696dd007189/xxsmall.png?1314043393</AvatarUrl>
<Sponsor>Computer Science and Electrical Engineering</Sponsor>
<PawCount>0</PawCount>
<CommentCount>0</CommentCount>
<CommentsAllowed>true</CommentsAllowed>
<PostedAt>Mon, 10 Mar 2014 22:15:47 -0400</PostedAt>
</NewsItem>

<NewsItem contentIssues="false" id="42279" important="false" status="posted" url="https://my3.my.umbc.edu/posts/42279">
<Title>NEW! Internships Opportunities for CAHSS Students</Title>
<Body>
<![CDATA[
    <div class="html-content">During the last week, multiple full-time jobs have been posted to UMBCworks for students like you! Check them out (plus many, many more opportunities) by logging in to UMBCworks today.<br><br>ID: 9263373 – Archives Assistant (Fire Museum of Maryland)<br><br>ID: 9263456 – Spring 2014 Public Relations Intern (The Gillen Group)<br><br>ID: 9263471 – Journalism Internship (The Borgen Project)<br><br>ID: 9262334 – Summer Intern (Asian Pacific American Institute for Congressional Studies)<br><br>ID: 9263374 – National Symphony Orchestra Operations Internship (The Kennedy Center)<br><br>ID: 9263377 – Intern Assistant for Art Gallery (Crystal Moll Gallery)<br><br>To access these positions, log in to your UMBCworks account (via the link in the Jobs &amp; Internships Topic inmyUMBC) and find details and application instructions as well as hundreds of other job postings! <br><br>Please note you MUST have an approved resume to apply to positions. To schedule an appointment, click on "Request a Counseling Appointment" via the UMBCworks homepage or call 410-455-2216.<br>
    </div>
]]>
</Body>
<Summary>During the last week, multiple full-time jobs have been posted to UMBCworks for students like you! Check them out (plus many, many more opportunities) by logging in to UMBCworks today.  ID:...</Summary>
<TrackingUrl>https://my3.my.umbc.edu/api/v0/pixel/news/42279/guest@my.umbc.edu/98f494a3004df3705c7919b8e7ef96a0/api/pixel</TrackingUrl>
<Tag>career</Tag>
<Tag>internships</Tag>
<Tag>jobs</Tag>
<Group token="careers">Career Center</Group>
<GroupUrl>https://my3.my.umbc.edu/groups/careers</GroupUrl>
<AvatarUrl>https://assets2-my.umbc.edu/system/shared/avatars/groups/000/000/018/729f2c7eeeab66f50f4ab3677539a585/xsmall.png?1411655278</AvatarUrl>
<AvatarUrl size="original">https://assets4-my.umbc.edu/system/shared/avatars/groups/000/000/018/729f2c7eeeab66f50f4ab3677539a585/original.jpg?1411655278</AvatarUrl>
<AvatarUrl size="xxlarge">https://assets2-my.umbc.edu/system/shared/avatars/groups/000/000/018/729f2c7eeeab66f50f4ab3677539a585/xxlarge.png?1411655278</AvatarUrl>
<AvatarUrl size="xlarge">https://assets1-my.umbc.edu/system/shared/avatars/groups/000/000/018/729f2c7eeeab66f50f4ab3677539a585/xlarge.png?1411655278</AvatarUrl>
<AvatarUrl size="large">https://assets2-my.umbc.edu/system/shared/avatars/groups/000/000/018/729f2c7eeeab66f50f4ab3677539a585/large.png?1411655278</AvatarUrl>
<AvatarUrl size="medium">https://assets3-my.umbc.edu/system/shared/avatars/groups/000/000/018/729f2c7eeeab66f50f4ab3677539a585/medium.png?1411655278</AvatarUrl>
<AvatarUrl size="small">https://assets3-my.umbc.edu/system/shared/avatars/groups/000/000/018/729f2c7eeeab66f50f4ab3677539a585/small.png?1411655278</AvatarUrl>
<AvatarUrl size="xsmall">https://assets2-my.umbc.edu/system/shared/avatars/groups/000/000/018/729f2c7eeeab66f50f4ab3677539a585/xsmall.png?1411655278</AvatarUrl>
<AvatarUrl size="xxsmall">https://assets2-my.umbc.edu/system/shared/avatars/groups/000/000/018/729f2c7eeeab66f50f4ab3677539a585/xxsmall.png?1411655278</AvatarUrl>
<Sponsor>Career Services Center</Sponsor>
<PawCount>2</PawCount>
<CommentCount>0</CommentCount>
<CommentsAllowed>false</CommentsAllowed>
<PostedAt>Mon, 10 Mar 2014 22:11:35 -0400</PostedAt>
<EditAt>Mon, 10 Mar 2014 22:14:43 -0400</EditAt>
</NewsItem>

<NewsItem contentIssues="true" id="42281" important="false" status="posted" url="https://my3.my.umbc.edu/posts/42281">
<Title>DealBook Column: Icahn&#8217;s War of Words With eBay</Title>
<Body>
<![CDATA[
    <div class="html-content">Carl C. Icahn, the activist investor, is in a battle with Marc Andreessen, the entrepreneur turned technology investor.<br><div><table border="0"><tbody><tr><td>
    <a href="http://share.feedsportal.com/share/twitter/?u=http%3A%2F%2Fdealbook.nytimes.com%2F2014%2F03%2F10%2Ficahns-war-of-words-with-ebay%2F%3Fpartner%3Drss%26emc%3Drss&amp;t=DealBook+Column%3A+Icahn%E2%80%99s+War+of+Words+With+eBay" rel="nofollow external" class="bo"><img src="http://res3.feedsportal.com/social/twitter.png" style="max-width: 100%; height: auto;"></a> <a href="http://share.feedsportal.com/share/facebook/?u=http%3A%2F%2Fdealbook.nytimes.com%2F2014%2F03%2F10%2Ficahns-war-of-words-with-ebay%2F%3Fpartner%3Drss%26emc%3Drss&amp;t=DealBook+Column%3A+Icahn%E2%80%99s+War+of+Words+With+eBay" rel="nofollow external" class="bo"><img src="http://res3.feedsportal.com/social/facebook.png" style="max-width: 100%; height: auto;"></a> <a href="http://share.feedsportal.com/share/linkedin/?u=http%3A%2F%2Fdealbook.nytimes.com%2F2014%2F03%2F10%2Ficahns-war-of-words-with-ebay%2F%3Fpartner%3Drss%26emc%3Drss&amp;t=DealBook+Column%3A+Icahn%E2%80%99s+War+of+Words+With+eBay" rel="nofollow external" class="bo"><img src="http://res3.feedsportal.com/social/linkedin.png" style="max-width: 100%; height: auto;"></a> <a href="http://share.feedsportal.com/share/gplus/?u=http%3A%2F%2Fdealbook.nytimes.com%2F2014%2F03%2F10%2Ficahns-war-of-words-with-ebay%2F%3Fpartner%3Drss%26emc%3Drss&amp;t=DealBook+Column%3A+Icahn%E2%80%99s+War+of+Words+With+eBay" rel="nofollow external" class="bo"><img src="http://res3.feedsportal.com/social/googleplus.png" style="max-width: 100%; height: auto;"></a> <a href="http://share.feedsportal.com/share/email/?u=http%3A%2F%2Fdealbook.nytimes.com%2F2014%2F03%2F10%2Ficahns-war-of-words-with-ebay%2F%3Fpartner%3Drss%26emc%3Drss&amp;t=DealBook+Column%3A+Icahn%E2%80%99s+War+of+Words+With+eBay" rel="nofollow external" class="bo"><img src="http://res3.feedsportal.com/social/email.png" style="max-width: 100%; height: auto;"></a>
    </td></tr></tbody></table></div>
    <br><br><a href="http://da.feedsportal.com/r/191801138682/u/0/f/640387/c/34625/s/3805c201/sc/21/rc/1/rc.htm" rel="nofollow external" class="bo"><img src="http://da.feedsportal.com/r/191801138682/u/0/f/640387/c/34625/s/3805c201/sc/21/rc/1/rc.img" style="max-width: 100%; height: auto;"></a><br><a href="http://da.feedsportal.com/r/191801138682/u/0/f/640387/c/34625/s/3805c201/sc/21/rc/2/rc.htm" rel="nofollow external" class="bo"><img src="http://da.feedsportal.com/r/191801138682/u/0/f/640387/c/34625/s/3805c201/sc/21/rc/2/rc.img" style="max-width: 100%; height: auto;"></a><br><a href="http://da.feedsportal.com/r/191801138682/u/0/f/640387/c/34625/s/3805c201/sc/21/rc/3/rc.htm" rel="nofollow external" class="bo"><img src="http://da.feedsportal.com/r/191801138682/u/0/f/640387/c/34625/s/3805c201/sc/21/rc/3/rc.img" style="max-width: 100%; height: auto;"></a><br><br><a href="http://da.feedsportal.com/r/191801138682/u/0/f/640387/c/34625/s/3805c201/a2.htm" rel="nofollow external" class="bo"><img src="http://da.feedsportal.com/r/191801138682/u/0/f/640387/c/34625/s/3805c201/a2.img" style="max-width: 100%; height: auto;"></a>
    </div>
]]>
</Body>
<Summary>Carl C. Icahn, the activist investor, is in a battle with Marc Andreessen, the entrepreneur turned technology investor.      </Summary>
<Website>http://rss.nytimes.com/c/34625/f/640387/s/3805c201/sc/21/l/0Ldealbook0Bnytimes0N0C20A140C0A30C10A0Cicahns0Ewar0Eof0Ewords0Ewith0Eebay0C0Dpartner0Frss0Gemc0Frss/story01.htm</Website>
<TrackingUrl>https://my3.my.umbc.edu/api/v0/pixel/news/42281/guest@my.umbc.edu/dd7021daf3e54c6b4333b8ae55edd617/api/pixel</TrackingUrl>
<Tag>dealbook-column</Tag>
<Tag>financial-services</Tag>
<Tag>hedge-funds</Tag>
<Tag>icahn-carl-c</Tag>
<Tag>new</Tag>
<Tag>skype-technologies</Tag>
<Tag>technology</Tag>
<Tag>top-headline-1</Tag>
<Tag>york</Tag>
<Group token="retired-583">Web Developer - Build Group</Group>
<GroupUrl>https://my3.my.umbc.edu/groups/retired-583</GroupUrl>
<AvatarUrl>https://assets3-my.umbc.edu/system/shared/avatars/groups/000/000/583/fc60f5d7abc2e080599bb6dc465db54d/xsmall.png?1363101197</AvatarUrl>
<AvatarUrl size="original">https://assets4-my.umbc.edu/system/shared/avatars/groups/000/000/583/fc60f5d7abc2e080599bb6dc465db54d/original.jpg?1363101197</AvatarUrl>
<AvatarUrl size="xxlarge">https://assets4-my.umbc.edu/system/shared/avatars/groups/000/000/583/fc60f5d7abc2e080599bb6dc465db54d/xxlarge.png?1363101197</AvatarUrl>
<AvatarUrl size="xlarge">https://assets4-my.umbc.edu/system/shared/avatars/groups/000/000/583/fc60f5d7abc2e080599bb6dc465db54d/xlarge.png?1363101197</AvatarUrl>
<AvatarUrl size="large">https://assets3-my.umbc.edu/system/shared/avatars/groups/000/000/583/fc60f5d7abc2e080599bb6dc465db54d/large.png?1363101197</AvatarUrl>
<AvatarUrl size="medium">https://assets3-my.umbc.edu/system/shared/avatars/groups/000/000/583/fc60f5d7abc2e080599bb6dc465db54d/medium.png?1363101197</AvatarUrl>
<AvatarUrl size="small">https://assets4-my.umbc.edu/system/shared/avatars/groups/000/000/583/fc60f5d7abc2e080599bb6dc465db54d/small.png?1363101197</AvatarUrl>
<AvatarUrl size="xsmall">https://assets3-my.umbc.edu/system/shared/avatars/groups/000/000/583/fc60f5d7abc2e080599bb6dc465db54d/xsmall.png?1363101197</AvatarUrl>
<AvatarUrl size="xxsmall">https://assets4-my.umbc.edu/system/shared/avatars/groups/000/000/583/fc60f5d7abc2e080599bb6dc465db54d/xxsmall.png?1363101197</AvatarUrl>
<Sponsor>Web Developer - Build Group</Sponsor>
<PawCount>0</PawCount>
<CommentCount>0</CommentCount>
<CommentsAllowed>true</CommentsAllowed>
<PostedAt>Mon, 10 Mar 2014 22:05:41 -0400</PostedAt>
<EditAt>Tue, 11 Mar 2014 13:31:36 -0400</EditAt>
</NewsItem>

<NewsItem contentIssues="true" id="42278" important="false" status="posted" url="https://my3.my.umbc.edu/posts/42278">
<Title>BreakingGround: Dr. Hoban, Kabish Shah and Allie O'Malley</Title>
<Tagline>Transforming Education through STEM</Tagline>
<Body>
<![CDATA[
    <div class="html-content"><p>Check out UMBC Honors College Faculty Fellow Dr. Susan Hoban, and Honors College students Kabish Shah and Allie O'Malley, featured on UMBC BreakingGround for their work conducting STEM professional development for K-12 teachers and informal educators and training future engineers in Howard and Anne Arundel County.  Together with UMBC’s “NASA’s BEST” team, (BEST stands for “Beginning Engineering, Science, and Technology,”) they helped middle schoolers design and construct small robots to serve as “seeing-eye robots” for NASA’s Curiosity rover on Mars.  <a href="http://my.umbc.edu/groups/bg/news/42242" rel="nofollow external" class="bo">Read more...</a></p></div>
]]>
</Body>
<Summary>Check out UMBC Honors College Faculty Fellow Dr. Susan Hoban, and Honors College students Kabish Shah and Allie O'Malley, featured on UMBC BreakingGround for their work conducting STEM...</Summary>
<Website>http://my.umbc.edu/groups/bg/news/42242</Website>
<TrackingUrl>https://my3.my.umbc.edu/api/v0/pixel/news/42278/guest@my.umbc.edu/87911a66af83326fddb11d2bbb37b138/api/pixel</TrackingUrl>
<Group token="honorscollege">Honors College</Group>
<GroupUrl>https://my3.my.umbc.edu/groups/honorscollege</GroupUrl>
<AvatarUrl>https://assets2-my.umbc.edu/system/shared/avatars/groups/000/000/413/cd2018beeece5fb0a71a96308e567bde/xsmall.png?1339897259</AvatarUrl>
<AvatarUrl size="original">https://assets1-my.umbc.edu/system/shared/avatars/groups/000/000/413/cd2018beeece5fb0a71a96308e567bde/original.jpg?1339897259</AvatarUrl>
<AvatarUrl size="xxlarge">https://assets1-my.umbc.edu/system/shared/avatars/groups/000/000/413/cd2018beeece5fb0a71a96308e567bde/xxlarge.png?1339897259</AvatarUrl>
<AvatarUrl size="xlarge">https://assets2-my.umbc.edu/system/shared/avatars/groups/000/000/413/cd2018beeece5fb0a71a96308e567bde/xlarge.png?1339897259</AvatarUrl>
<AvatarUrl size="large">https://assets2-my.umbc.edu/system/shared/avatars/groups/000/000/413/cd2018beeece5fb0a71a96308e567bde/large.png?1339897259</AvatarUrl>
<AvatarUrl size="medium">https://assets1-my.umbc.edu/system/shared/avatars/groups/000/000/413/cd2018beeece5fb0a71a96308e567bde/medium.png?1339897259</AvatarUrl>
<AvatarUrl size="small">https://assets1-my.umbc.edu/system/shared/avatars/groups/000/000/413/cd2018beeece5fb0a71a96308e567bde/small.png?1339897259</AvatarUrl>
<AvatarUrl size="xsmall">https://assets2-my.umbc.edu/system/shared/avatars/groups/000/000/413/cd2018beeece5fb0a71a96308e567bde/xsmall.png?1339897259</AvatarUrl>
<AvatarUrl size="xxsmall">https://assets1-my.umbc.edu/system/shared/avatars/groups/000/000/413/cd2018beeece5fb0a71a96308e567bde/xxsmall.png?1339897259</AvatarUrl>
<Sponsor>Honors College</Sponsor>
<ThumbnailUrl size="xxlarge">https://assets2-my.umbc.edu/system/shared/thumbnails/news/000/042/278/8e1d97d44ddafb6025fc1a0c97faff74/xxlarge.jpg?1394500013</ThumbnailUrl>
<ThumbnailUrl size="xlarge">https://assets1-my.umbc.edu/system/shared/thumbnails/news/000/042/278/8e1d97d44ddafb6025fc1a0c97faff74/xlarge.jpg?1394500013</ThumbnailUrl>
<ThumbnailUrl size="large">https://assets2-my.umbc.edu/system/shared/thumbnails/news/000/042/278/8e1d97d44ddafb6025fc1a0c97faff74/large.jpg?1394500013</ThumbnailUrl>
<ThumbnailUrl size="medium">https://assets1-my.umbc.edu/system/shared/thumbnails/news/000/042/278/8e1d97d44ddafb6025fc1a0c97faff74/medium.jpg?1394500013</ThumbnailUrl>
<ThumbnailUrl size="small">https://assets2-my.umbc.edu/system/shared/thumbnails/news/000/042/278/8e1d97d44ddafb6025fc1a0c97faff74/small.jpg?1394500013</ThumbnailUrl>
<ThumbnailUrl size="xsmall">https://assets4-my.umbc.edu/system/shared/thumbnails/news/000/042/278/8e1d97d44ddafb6025fc1a0c97faff74/xsmall.jpg?1394500013</ThumbnailUrl>
<ThumbnailUrl size="xxsmall">https://assets2-my.umbc.edu/system/shared/thumbnails/news/000/042/278/8e1d97d44ddafb6025fc1a0c97faff74/xxsmall.jpg?1394500013</ThumbnailUrl>
<PawCount>2</PawCount>
<CommentCount>0</CommentCount>
<CommentsAllowed>false</CommentsAllowed>
<PostedAt>Mon, 10 Mar 2014 21:09:49 -0400</PostedAt>
<EditAt>Tue, 11 Mar 2014 10:23:03 -0400</EditAt>
</NewsItem>

</News>