Register today!
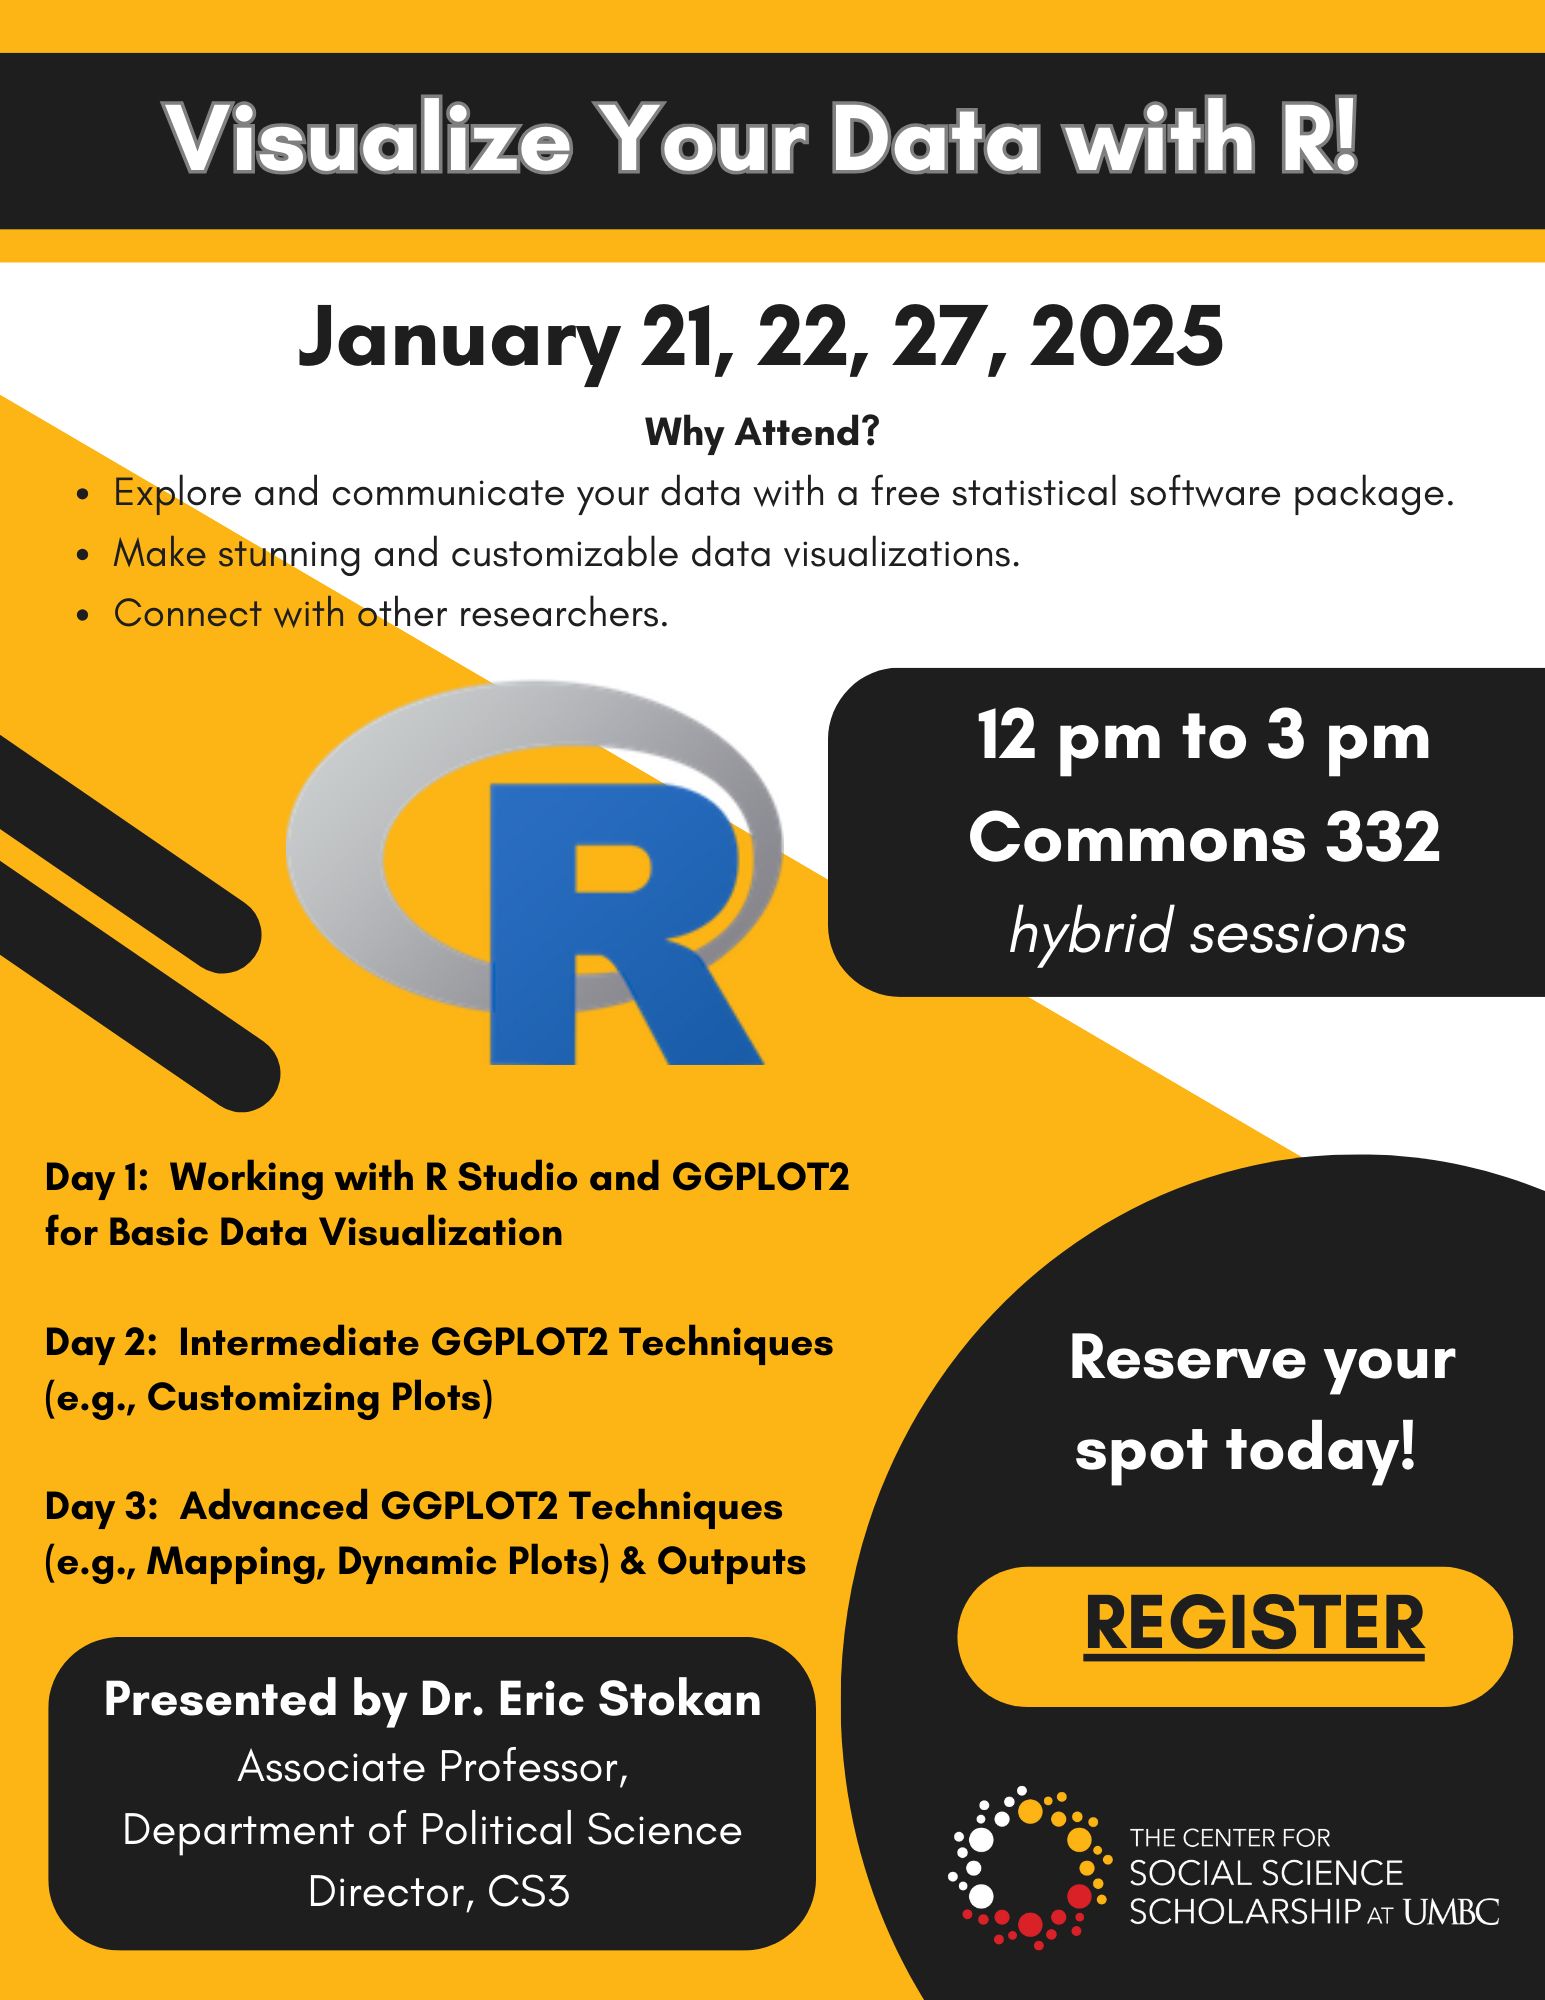
January 21, 22, and 27 | 12:00 - 3:00pm | Commons 332 or Webex
Why Attend?
- Explore and communicate your data with a free statistical software package.
- Make stunning and customizable data visualizations.
- Connect with other researchers.
Schedule:
Day 1: Working with R Studio and GGPLOT2 for Basic Data Visualization
Day 2: Intermediate GGPLOT2 Techniques (e.g., Customizing Plots)
Day 3: Advanced GGPLOT2 Techniques (e.g., Mapping, Dynamic Plots) & Outputs
Presented by Dr. Eric Stokan, Associate Professor, Department of Political Science and Director, CS3.
